2709, 2024
Get Notified: Setting Up Alerts in Grafana
If you are using Grafana to monitor your systems, you are already ahead of the game. But did you know that you can also use Grafana to set up alerts? This is a great way to get notified when something goes wrong with your systems. In this blog post, we will show you how to [...]
2012, 2023
Cluster Monitoring with Prometheus & Grafana on EC2 Instances
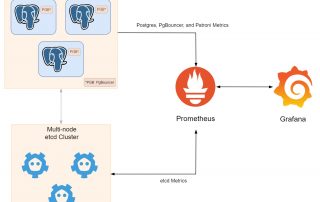
In the previous blog post, Exporting metrics from etcd, PostgreSQL, PgBouncer and Patroni, we have prepared the endpoints for Prometheus to scrape metrics from etcd, PostgreSQL, PgBouncer and Patroni. In this blog post, we will use those endpoints to monitor the cluster with Prometheus and Grafana on EC2 instances. Prerequisites Make sure you [...]

