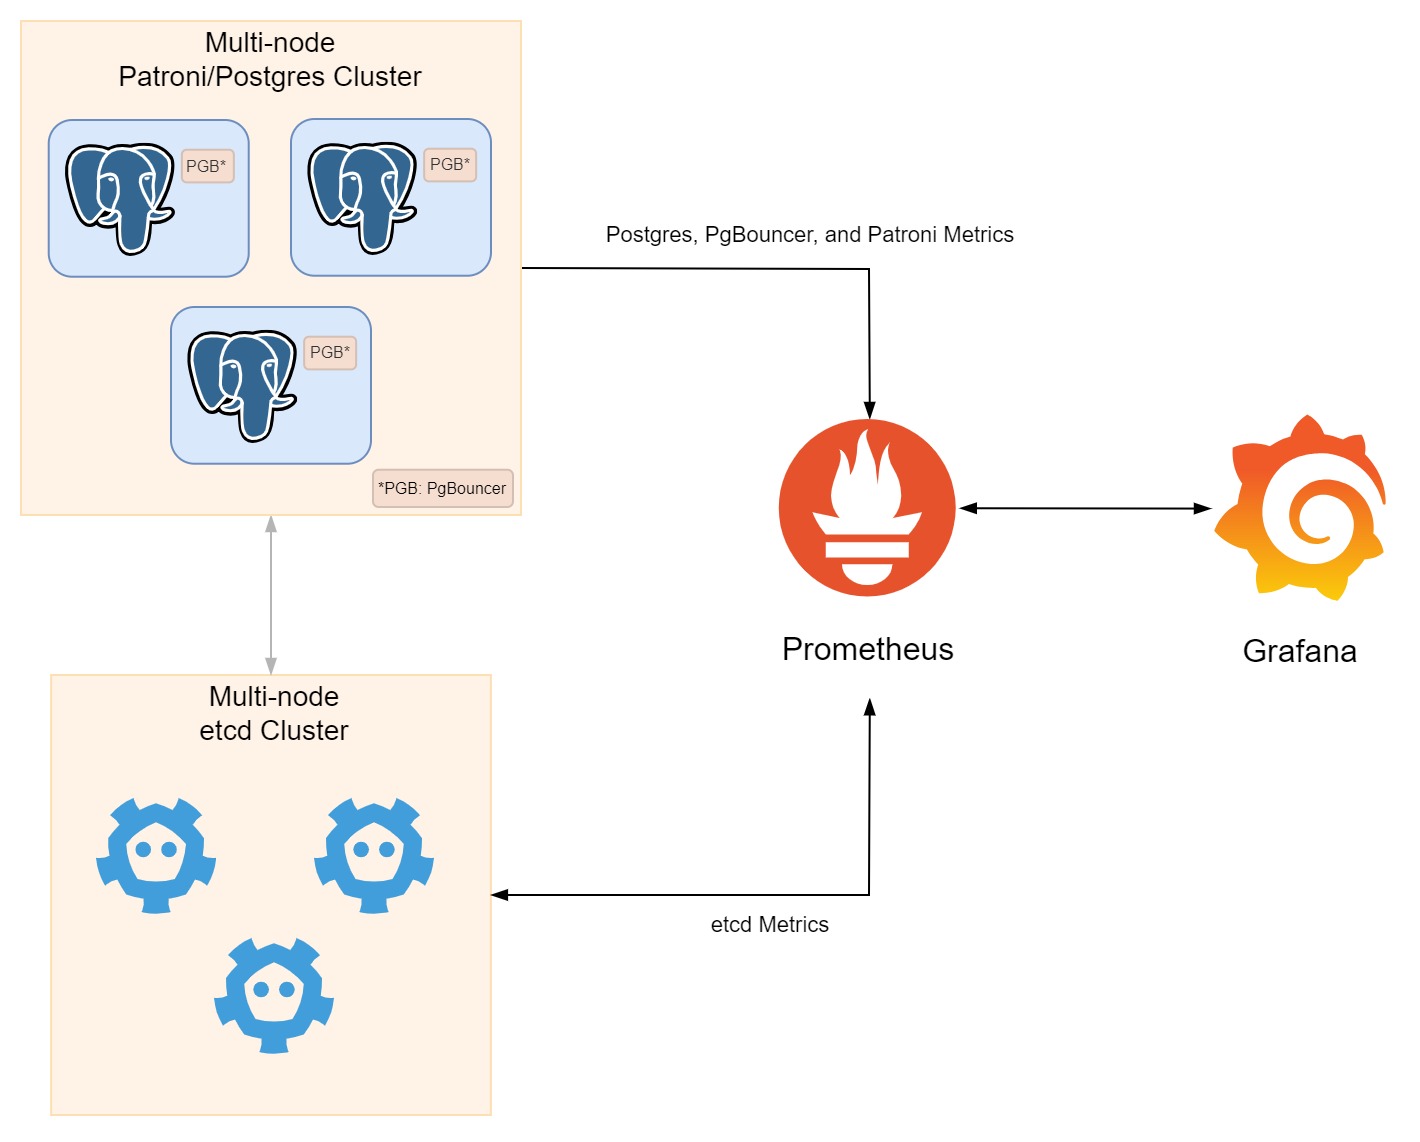
In the previous blog post, Exporting metrics from etcd, PostgreSQL, PgBouncer and Patroni, we have prepared the endpoints for Prometheus to scrape metrics from etcd, PostgreSQL, PgBouncer and Patroni. In this blog post, we will use those endpoints to monitor the cluster with Prometheus and Grafana on EC2 instances.
Prerequisites
Make sure you have followed the steps from the previous blog to prepare the endpoints for Prometheus to scrape metrics from etcd, PostgreSQL, PgBouncer and Patroni, since we will be using those endpoints.
Prometheus on EC2 Instances
We will use the Ansible task from the previous blog to provision a new EC2 instance, but we will need a new Butane file, which will be attached to the instance as a user data. One of the service units in the Butane file is Prometheus, which will be executed inside a Podman container.
The Prometheus configuration file is located at /usr/local/share/prometheus.yml on the host, which will be mounted to /etc/prometheus/prometheus.yml inside the container. The Prometheus configuration file is as follows:
The Prometheus configuration file is pretty straightforward. We have defined four jobs, each of which will scrape metrics from the endpoints of etcd, PostgreSQL (through postgres_exporter), PgBouncer (through pgbouncer_exporter) and Patroni. The endpoints are defined as targets, and the labels are used to group the metrics. The Prometheus configuration file also defines the TLS configuration for each job, since it will be scraping metrics from the endpoints through HTTPS.
That’s it for Prometheus. Now, let’s move on to Grafana.
Preparing Grafana Systemd Service Unit
Let’s add another systemd service unit to the Butane file, which will be used to run Grafana inside a Podman container. The service unit is as follows:
First, we need to create a volume for Grafana to store its data. The volume will be created with the command podman volume create grafana-storage. The volume will be mounted to /var/lib/grafana inside the container. After that, we will run Grafana inside a Podman container. There are a lot of environment variables that can be used to configure Grafana, but for the sake of simplicity, we will only use GF_SECURITY_ADMIN_PASSWORD to set the password for the admin user. The Grafana container will also use a volume to store its data, which will be mounted to /var/lib/grafana inside the container. If you want to know more about the environment variables that can be used to configure Grafana, you can check this page.
At this point we have prepared the Prometheus and Grafana service units. Now, we can provision a new EC2 instance running Prometheus and Grafana!
Importing Data Source and Dashboard to Grafana with Ansible
After Prometheus and Grafana are up and running, we need to import the data source and dashboard to Grafana. We can do this with Ansible. First, we need to install the Grafana plugin for Prometheus with the command ansible-galaxy collection install community.grafana. After that, we can create a the tasks ti import the data source and dashboards to Grafana new Ansible playbook to import the data source and dashboard to Grafana.
The task to import the data source is as follows:
The task to import the dashboards is as follows:
Make sure to replace <cluster-name> with the name of the Grafana dashboard JSON file. The JSON file for each dashboards can be downloaded from our GitHub repository here.
Here are some screenshots of the Grafana dashboard:

etcd dashboard – Etcd by Prometheus

PostgreSQL-Dashboard – PostgreSQL-Datenbank

PgBouncer dashboard – PostgreSQL PGbouncer

Patroni dashboard – PostgreSQL Patroni
Keep in mind that the dashboards from the original source may not work out of the box, since we have a few modifications to the panels, variables and queries. You can check the JSON files for the dashboards in our GitHub repository here.
Wrapping Up
In this blog post, we have learned how to setup monitoring for the cluster with Prometheus and Grafana on EC2 instances. We have also learned how to import the data source and dashboard to Grafana with Ansible. As maybe you have noticed, it is not that hard to prepare a monitoring system for your PostgreSQL cluster. We hope this blog post can help you to prepare a monitoring system for your PostgreSQL cluster. Stay tuned for more blog posts to extend our series.

Farouq Abdurrahman ist Praktikant bei der Proventa GmbH und studiert Informatik. Sein Schwerpunkt liegt auf Cloud Computing. Er hat großes Interesse an der Digitalen Transformation und Cloud Computing. Aktuell beschäftigt er sich mit PostgreSQL Datenbanken in der Cloud.