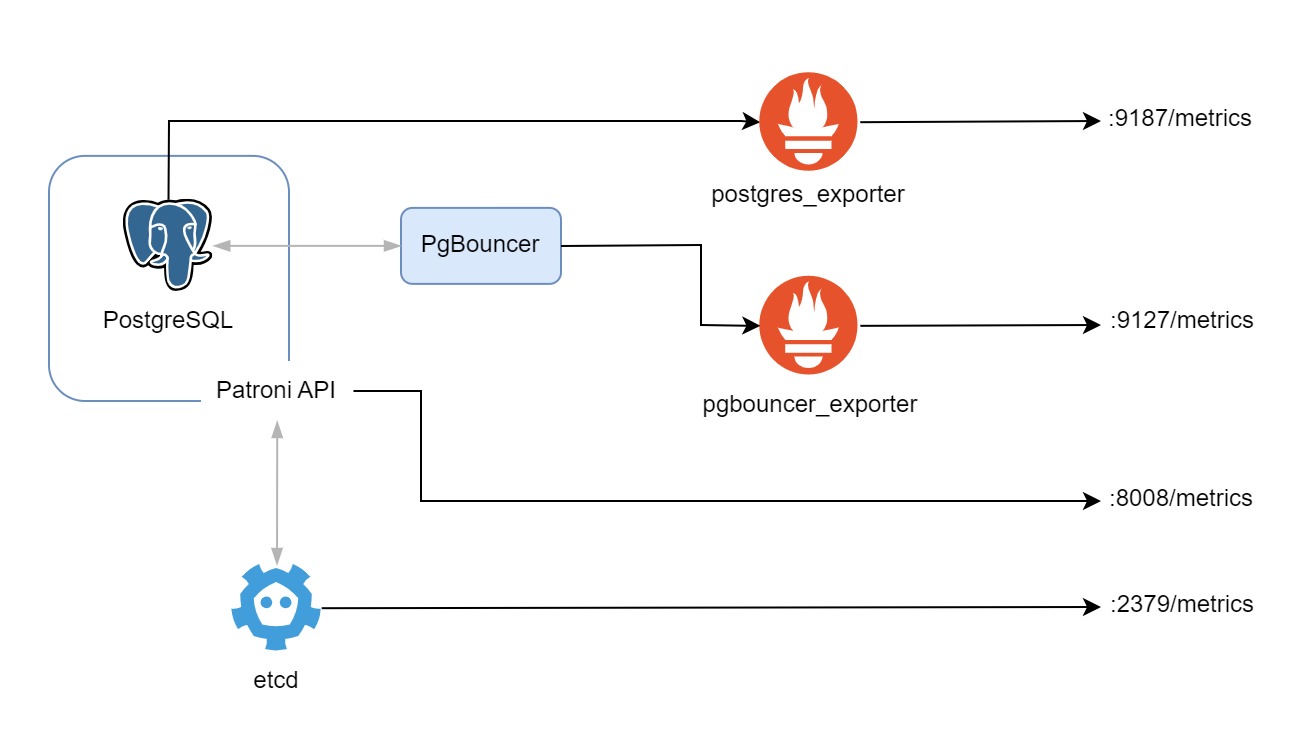
In today’s complex IT landscapes, monitoring is not just a nice-to-have but a necessity. It is important to know what is going on in your systems, and to be able to react quickly to any issues that arise. In this blog post, we will look at how to expose metrics from etcd, PostgreSQL, PgBouncer and Patroni. This is the foundation for another blog entry to collect metrics with Prometheus and visualize the state with Grafana.
Prerequisites
Before we proceed, it’s important to note that this blog post assumes that you have already gone through the previous blog post titled Setting up a Connection Pooler for PostgreSQL on EC2 Instances. In this current blog post, we will rely on the etcd cluster, and the Postgres cluster along with the PgBouncer created there, to export metrics from.
Exporting metrics from etcd
etcd already has a built-in metrics exporter. This will expose the metrics on port 2379 by default. To verify that the metrics are being exported, you can SSH into one of the etcd nodes and run the following command:
You should see a response similar to the following:
If you see the above response, then your etcd cluster is ready to be scraped by Prometheus. So let’s move on to the next step.
Exporting metrics from PostgreSQL
Since PostgreSQL does not have a built-in metrics exporter, we will need to use a service called postgres_exporter. This is a community-driven project that provides a metrics exporter for PostgreSQL. It comes in a container image, which makes it easy to deploy. We will run the container in the same VM as the PostgreSQL cluster, and expose the metrics on port 9187. Here is the systemd butane configuration for the postgres_exporter:
Whereas the web-config.yml file in the storage.files section of the same butane configuration is as follows:
The above configuration will run the postgres_exporter container, and expose the metrics on port 9187. It will also use the self-signed certificates that we generated with a script mentioned in the previous blog posts. Therefore, the metrics will be secured with TLS.
Other than that, we also specify the DATA_SOURCE_URI, DATA_SOURCE_USER and DATA_SOURCE_PASS environment variables. These are the credentials that the postgres_exporter will use to connect to the PostgreSQL cluster. The DATA_SOURCE_URI is the URI of the PostgreSQL cluster. In our case, we will be using the URI localhost:5432 since we will be running the postgres_exporter container in the same VM as the PostgreSQL cluster. The DATA_SOURCE_USER and DATA_SOURCE_PASS are the credentials of the PostgreSQL cluster. In our case, we will be using the credentials postgres and zalando respectively.
Now that we have the systemd butane configuration for the postgres_exporter, we can deploy it by running the Ansible playbook script. Once the playbook script has finished running, the postgres_exporter container will be running in the same VM as the PostgreSQL cluster, and exposing the metrics on port 9187.
Verifying the postgres_exporter service
To verify that the metrics are being exported, you can SSH into one of the PostgreSQL nodes and run the following command:
You should see a response similar to the following:
If you see the above response, then your PostgreSQL cluster is ready to be scraped by Prometheus. So let’s move on to the next step.
Exporting metrics from PgBouncer
Since PgBouncer does not have a built-in metrics exporter, we will need to use a service called pgbouncer_exporter. Similar to the postgres_exporter, it also comes in a container image, which makes it very easy to deploy. We will run the container in the same VM as the PgBouncer, and expose the metrics on port 9127. Here is the systemd butane configuration for the pgbouncer_exporter:
Whereas the web-config.yml file is the same as the one used for the postgres_exporter. The above configuration will run the pgbouncer_exporter container, and expose the metrics on port 9127. The metrics will also be secured with TLS just like the postgres_exporter.
We also specify the pgBouncer.connectionString environment variable. This is the connection string that the pgbouncer_exporter will use to connect to the PgBouncer cluster. In our case, we will be using the connection string
postgresql://stats_collector:collector_stats@localhost:6432/pgbouncer.
After adding the systemd unit file to the butane configuration file that we created on the previous blog, we can run deploy it by running the Ansible playbook script. The pgbouncer_exporter container will be running in the same VM as the PgBouncer, and exposing the metrics on port 9127.
Verifying the pgbouncer_exporter service
To verify that the metrics are being exported, you can SSH into one of the PgBouncer nodes and run the following command:
You should see a response similar to the following:
If you see the above response, then your PgBouncer cluster is ready to be scraped by Prometheus. So let’s move on to the last step, that is, metrics from Patroni.
Exporting metrics from Patroni
Patroni comes with a built-in metrics exporter. Therefore we don’t need to use any third-party tools to export metrics from Patroni. The metrics are exposed on port 8008 by default. To verify that the metrics are being exported, you can SSH into one of the Patroni nodes and run the following command:
You should see a response similar to the following:
If you see the above response, then your Patroni cluster is ready to be scraped by Prometheus.
Wrapping up
In this blog post, we looked at how to export metrics from etcd, PostgreSQL, PgBouncer and Patroni. Now that the endpoints are ready to be scraped by Prometheus, we can move on to the next blog post where we will look at how to set up Prometheus and Grafana to visualize the metrics. So, stay tuned!

Farouq Abdurrahman ist Praktikant bei der Proventa GmbH und studiert Informatik. Sein Schwerpunkt liegt auf Cloud Computing. Er hat großes Interesse an der Digitalen Transformation und Cloud Computing. Aktuell beschäftigt er sich mit PostgreSQL Datenbanken in der Cloud.